Open platform hackAIR maps current air quality in Europe’s cities – powered by citizens and smart technology
Citizens can use the app and low-cost sensors to generate their own measurements of air quality to enrich official data, and find out how to avoid and reduce particulate matter pollution
Press release – 8 February 2018
Today, hackAIR launches its apps for iOS and Android, connected to an online platform at www.hackair.eu, where citizens in Europe can check the air quality in their neighbourhood. In turn, everyone can improve the data from official sources with their own measurements, for instance by simply uploading a photo of the sky with their smartphone.
With air pollution being the number one environmental concern of European citizens and the number one environmental cause of illness and death in urban centres, hackAIR provides actionable information on the most important type of air pollution: particulate matter pollution. Particulate matter pollution is a complex mixture of extremely small particles in the air, which are easily inhaled.
Around 90% of Europeans living in cities are exposed to levels of air pollution deemed damaging to human health. Whilst the damaging impacts of particulate matter pollution are widely recognised, official air quality data show significant gaps and are often difficult to access.
The hackAIR platform aims to make that data readily available and improve the official datasets by combining them with measurements from users. They can take photos of the sky, use a piece of cardboard with petroleum jelly, or build their own microcomputer sensor in an afternoon.
“Many Europeans rightly worry about air quality: how clean is the air I breathe, when I live near a major road, airport or industrial zone? The hackAIR platform gives them the answer, and helps them to contribute their own measurements to make that answer better, more relevant and actionable,” says Evangelos Kosmidis, Physicist and Founder of DRAXIS.
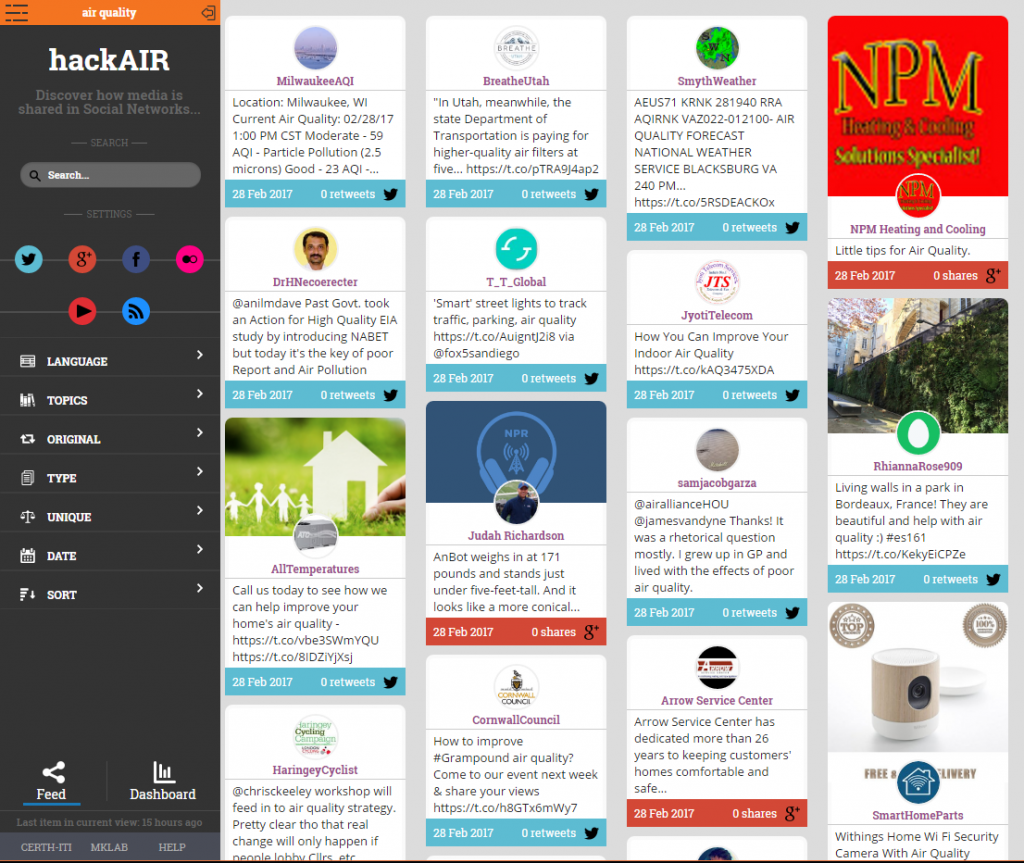
The hackAIR service is location-based and real-time, offering users a map-based interface to the data available on the air quality in their neighbourhood. With that information, they can find areas with clean air for relaxation and sports, and which areas to avoid because of high pollution levels. Citizens with concerns over air pollution can also use the platform to get better informed and involved in the discourse to improve air quality, locally and on a larger scale.
hackAIR offers four ways for users to contribute their own air quality data:
- They can submit photos of the sky using the hackAIR app. An algorithm gives a rough estimate of air pollution levels.
- They can build a simple cardboard sensor that uses the discoloration of petroleum jelly to get an estimate of the amount of particulate matter pollution.
- hackAIR provides manuals and workshops to build stationary and portable microcomputer air quality sensors. These sensors are cheap, easy-to-build and provide high-quality data.
- Experienced users can submit and access data using an online application programme interface (API).
In the coming year, hackAIR is organising a series of workshops in the pilot countries Germany, Norway, Greece and Belgium to raise awareness and train people on air quality, how to build sensors, and how to use the resulting information.
“Air pollution is the environmental issue that Europeans worry about the most. But they do not feel sufficiently informed about the issues, and its impact on their health in their country. With the app, the workshops and the sensors, hackAIR aims to empower them to make better decisions based on better information,” says Arne Fellermann, BUND/Friends of the Earth Germany.
The app and platform
The app can be downloaded for iOs and Android from www.hackair.eu.
The platform is accessible at platform.hackair.eu.
About hackAIR
hackAIR is a collaboration of six European organisations working on air pollution, environment, technology, citizen science and research.
The partners are DRAXIS (Greece), NILU (Norway), CERTH (Greece), BUND (Germany), Vrije Universiteit Brussel (Belgium) and ON:SUBJECT (the Netherlands). The Democritus University of Thrace, the Technological Educational Institute of Athens and CREVIS contribute as third parties affiliated to DRAXIS Environmental S.A.
hackAIR is supported by the Horizon 2020 programme on ‘Collective Awareness Platforms for Sustainability and Social Innovation’ of the European Union under grant agreement number 688363.


