Report: Build your own sensor – in Norway

The hackAIR pilot project in Norway has an ambitious objective: to get enough low-cost sensors running across the city of Oslo that street-level predictions of air quality become possible. 57 hackAIR home sensors have already been distributed – contact NILU if you want to host one as well.

Last week, 16 citizens from different backgrounds (scientists, students, professionals working on meteorology and occupational health and other interested people) met in Oslo to build their own air quality sensors, together with the Norwegian hackAIR partner NILU. To make the process easier, the team had prepared a USB stick with the necessary software so that participants could download it from the stick and save time. Several of the sensors that were assembled in this workshop are already up and running at participants’ homes in the Oslo region.


On April 25, the hackAIR team at NILU offered a breakfast seminar at Oslo Science Park. 45 participants came: researchers, policy-makers, entrepreneurs and university students. Hai-Ying Liu presented the hackAIR platform with its features, the hackAIR app and the different air quality sensors. The assessment results of the performance of the sensors that are currently researched in Oslo were also part of the presentation. The seminar participants engaged in a lively discussion with interesting questions.

Thanks to the recent activities, hackAIR is now also spreading beyond Oslo to the city of Bergen:

How accurate are the hackAIR sensors?

One common criticism towards low-cost air quality sensors such as the ones used by hackAIR is that they cannot achieve the accuracy of more expensive reference stations. We set out to test this claim. The hackAIR air quality test station is now active in Athens since October 2017. 

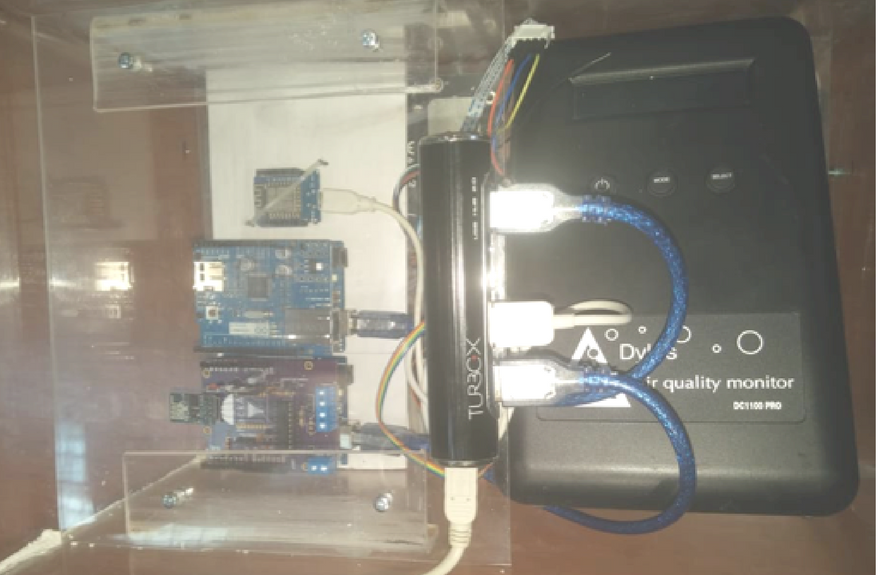
Using the setup pictured on the right, we wanted to make a single installation site for all hackAIR sensing devices, including all supported hardware and sensors. In particular, we were interested in understanding the impact of humidity and temperature on the measurements and whether the measurements would shift over time due to ageing. In addition, we included a commercial air quality sensor.

sensors athens

Sensors in the hackAIR air quality test station

  • hackAIR home v2 (Wemos, sensors used: DfRobot SEN0177 and DHT11)
  • hackAIR home v1 (Arduino Ethernet, sensor used: DfRobot SDS011)
  • hackAIR home v1 (Arduino WiFi, sensor used: DfRobot SEN0177)
  • hackAIR cardboard
  • Dylos DC1100 (commercial reference sensor)

What did we find out?

We saw the measurements of the hackAIR low-cost sensors correlate sufficiently well with the reference measurements. hackAIR’s power saving protocol proved to be effective in protecting sensors from rapid ageing: we did not detect any shift after almost 6 months of continuous measurements. 

Humidity and temperature constitute two significant factors that influence the quality of fine particles and thus impact the corresponding sensor recordings. hackAIR is using a normalisation function on the sensor itself to adjust the air measurements in these situations. 

During the testing period, the devices showed acceptable network stability: no disconnections were recorded. We were able to fix a minor problem with the ethernet http connection. 

While this initial test site in Athens is still operational, we want to set up an additional installation next to an official measuring sites to be able to directly compare hackAIR measurements with official air quality information. 

Citizen activism: Tackling air pollution across Europe

This week’s blog post features four citizen initiatives that are taking action to reduce air pollution – in Belgium Kosovo, Bulgaria and Great Britain. Better air quality information enables us to fight for better air in where we live: Get inspired by these stories – and share with us what you are up to!

Help – I can’t breathe: Parents take action on air pollution around schools in Belgium 

On March 14, 2018 a report in Belgian national television informed the public about the dangerous levels of air pollution around schools. This documentary showed the results of a large scale study on air quality and used two schools as examples. 

The next day, the first protest actions happened at school streets. Filter Cafe Filtre was born.

The invitation is simple and powerful: “Close off the street where your school is to traffic every Friday morning before school starts. Have a cup of coffee together and let the children play in the car-free street. Invite local politicians to come and join you for a coffee.”

The initiative is growing: on April 20, 60 parent groups across Belgium took part. The mission is to raise awareness and change mindsets of parents and children, and to convey the urgency to policymakers.

Get data – Drive change: Youth-led air quality campaign in Kosovo

Kosovo is one of the most polluted regions in Europe. The project “Science for Change Kosovo” is a youth-led environmental movement, investigating air pollution in Kosovo and mobilizing people to take actions. The project was one of the partners in the Making Sense project. 

It works with local youth around environmental policy issues, how to collect data about air quality, and how to use this data to advocate for change. Their approach was documented in the Making Sense toolkit for citizen science initiatives – have a look!

Bulgaria: New collaboration between citizen activists and government to reduce air pollution

Air pollution is much worse in Eastern Europe. In Sofia, air pollution norms were exceeded on 70 days between October 2017 and March 2018. Government and activists are working hand-in-hand to improve the situation. The citizens’ group “AirBG.info” was founded in April 2017 and has rapidly expanded their network in the first year of their activities.

This initiative maps air quality with low-budget sensors, built by citizens. The open data from this citizen science project are collected at the luftdaten platform. Currently, 600 air quality sensors are operating in Bulgaria, nearly 300 of them in the capital. AirBG.info has been very successful in establishing a close collaboration with the Bulgarian government and with the environmental executive agency. This collaboration led to the decision that Bulgaria will integrate all existing air quality monitoring systems. The Environment Minister said: “We are trying to integrate all [air quality monitoring] systems: those of non-government organizations, of which there is a myriad but are less precise, and those of the Executive Agency for Environment, which are fewer but are more precise, in order to get a clear picture about the quality of air we breathe.”

Parents campaign for clean air in London

Mums for Lungs is a London based group of parents who are seriously concerned about the dangerous impact air pollution is having on children’s health. They have set up air quality campaigns in various contexts.

In March 2018, they campaigned for the extension of the Ultra Low Emission Zone in London. Within this zone, most vehicles will have to meet emissions standards or pay a daily charge. In London, around half of emissions of particulate matter (PM) come from transport. The Ultra Low Emission Zone will reduce the most harmful emissions generated by road traffic. Mums for Lungs, together with a number of local partners, has been calling to extend this zone so that more inhabitants of London can benefit from cleaner air.

In the ongoing local elections, Mums for Lungs has proposed a number of pledges to local parties – raising awareness about air quality. The pledges are also a way to hold policy makers accountable – after the elections.

What’s the science behind hackAIR’s sky photo analysis?

Have you taken a sky photo with the hackAIR app? Are you curious how the app estimates the air quality, based on your photo? Do you want to know more about the science behind this feature?

Even with your bare eyes, you can see that the cloudless sky is not always the same blue. The color of the sky changes with the time of the year and time of the day, but it also changes when particles are present in the atmosphere. In very polluted cities the sky often does not appear very blue, while it can be deep blue when it has rained recently and it is very windy and it can also be deep blue in remote locations.

The feature

Once you have taken a sky photo with your hackAIR mobile app, the image is uploaded to the hackAIR server where we analyse the colour of the sky and estimate the current air quality. When the calculations have completed, the picture is shown on the hackAIR map with an estimate of the air quality.

Behind the scenes

  • Step 1: A computer algorithm detects the portion of blue sky in the photo. As the lower parts of photos often show buildings or landscape, this part is discarded by the hackAIR system. From the recognised sky, the upper third is used for further analysis.
  • Step 2: Using the average colour detected, hackAIR then calculates the ratio between red and green light bands (R/G ratio).
  • Step 3: We then look up this ratio in a table that lists the corresponding air quality value in relation to the location and time of day at which the photo was taken.
  • Step 4: The estimated rating of the air quality, together with the photo, is shown on the hackAIR platform.

The scientific background

The main idea is that the ratio of red and green band of the light (R/G) depends on the amount and type of aerosols in the atmosphere (R/G increases with increasing AOD).

Aerosols, which are tiny particles suspended in the atmosphere, are emitted by natural (e.g., volcanoes, desert dust, forest fires, sea salt) as well as human activities (e.g., biomass burning, combustion of fossil fuel, industrial activities). Aerosols affect the levels of surface solar radiation by scattering and absorbing the light coming from the sun reducing the visibility in the atmosphere.

By measuring the radiation that reaches the ground at specific wavelengths we can assess the degree to which aerosols prevent the transmission of light by absorption or scattering. This is expressed as aerosol optical depth (AOD). AOD is unitless and usually reported at a wavelength of 550 nm. A value of 0.01 corresponds to an extremely clean atmosphere (air quality = very good), and a value of 0.4 would correspond to a very hazy condition (air quality = bad).

To control for varying atmospheric conditions, we produced a set of look-up tables using a  radiative transfer model (RTM). RTMs calculate the intensity of the light transferred within the atmosphere under different user-input scenarios that include information about the position of sun (solar zenith angle) relative to Earth and various atmospheric parameters (e.g., clouds, aerosols, water vapour, ozone, surface albedo, etc.).

We then compare the measured light intensities with those expected conditions to retrieve an estimate of the current aerosol optical depth.

A similar approach has been used to examine the atmospheric effects of volcanic eruptions in historical paintings1. Instead of the painter’s eyes, hackAIR uses mobile images and publicly available images from Flickr and webcams. We performed a number of tests to check the effect of the camera type on R/G ratios – as previous studies indicate, this is not a major issue.

Future potential

This analysis of sky photos makes it possible to monitor air quality in urban and rural environments with easily available tools: digital and mobile cameras. This estimation of air quality supports citizens in collecting more valuable information about the quality of the air: e.g. in their neighbourhood, around schools, in busy streets.

hackAIR uses the sky photo analysis not only for images provided by users through the mobile app. This image analysis is also used by the hackAIR tech team to analyse a very large number of photos from Flickr and webcams.


1 Zerefos, C. S., Gerogiannis, V. T., Balis, D., Zerefos, S. C., and Kazantzidis, A.: Atmospheric effects of volcanic eruptions as seen by famous artists and depicted in their paintings, Atmos. Chem. Phys., 7, 4027-4042, https://doi.org/10.5194/acp-7-4027-2007, 2007.

hackAIR app: Sky photos for air quality estimation

Just one click on your smartphone – and you know more about the air quality in your neighbourhood!

With the hackAIR app , you can take a sky photo that will be analysed and will inform you about the estimated levels of air pollution. Contribute to the growing number of sky photos on the hackAIR platform and learn more about the air quality where you live.

Here is a step-by-step guide how to do it.

Step 1: Download the hackAIR app (if you haven’t done so already)

Step 2: Check the weather: you need at least some BLUE sky (not only clouds)

Step 3: Consider time of the day: don’t take photos close to sunset or sunrise

Step 4: Go to the app feature “Take a sky photo”

Step 5: Hold your phone in an upright position (see above)

Step 6: Focus your phone camera on sky – do not photograph the sun directly

Step 7: Take a photo

Step 8: Submit your photo to the hackAIR platform through the app feature


Your photo will show up in your hackAIR user profile immediately. It takes a couple of hours until your photo is analysed and is visible on the map of the hackAIR platform. You can search for your sky photos by choosing “My photos” on the platform.


(Sky photo published on hackAIR platform, taken on March 27. Rated as good air quality.)


How does this work?

Particles in the atmosphere (dust, smoke, pollution) can block sunlight by absorbing or by scattering light. This affects the colour of the blue sky. From your image, we calculate the ratio between red and green. This ratio, in correlation to location, time and date, allows an estimation of the current air pollution levels.

Make sense of your hackAIR sensor data

Once you’ve set up your hackAIR sensors, the question is: what can you do with the data? Of course, you can check it day by day on the map, but wouldn’t it be cool to do more? Let’s see what’s already possible.

This blog post has been written for hackAIR users who are familiar with Excel and curious about data visualisation. Please check out what hackAIR communications lead Wiebke Herding has learned about visualising data! We’d also love to hear from you what you have been experimenting with.

From the sensor profile

Each sensor has its own profile page that you can find by going to Profile > Sensors. After a moment’s wait, you’ll get a list of the latest measurements translated as air quality ratings.

Using the ‘Export Measurements’ button, you can then download the exact measurements from your sensor in CSV format. This way, you can export 5000 measurements at a time – if you need more, just run multiple exports. Note: the timestamp in the export is in GMT – depending on your own time zone, you might need to adjust this (e.g. add an hour if you are based in Berlin).

Air pollution over time with Excel

After downloading the files, you can open them in Excel. I then added three columns to be able to access the values I was interested in:

  • Date CET: =<Date>+”01:00″
  • PM10: =IF(<Pollutant_Q_Name>=”PM10_AirPollutantValue”,<Pollutant_Q_Value>,””)
  • PM2.5: =IF(<Pollutant_Q_Name>=”PM2.5_AirPollutantValue”,<Pollutant_Q_Value>,””)

Note: these formulas assume that you use English localisation settings. If you use Excel in a different language, you might need to adjust quotation marks and commas.

Using Insert >PivotChart, I created a chart with Date CET as the axis and PM10 and PM2.5 as the values. I set both values to show the average PM measurement and changed the chart type to a line graph. The result was a time series of daily averages:

Using the report filter buttons at the bottom right, I could then zoom into the hourly averages and finally into the individual measurements.

As I am currently running two sensors (120 is a hackAIR home v1 at the front of my house, 255 is a hackAIR home v2 in a more protected space at the back), I can also compare the two:


On average, the sensor at the front of my house picked up 53% more PM10 particles, and 23% more PM2.5 particles in the testing period.

Building graphs that update themselves

As downloading the files can get tedious over time, we could also use the hackAIR API to access our data. We can use a service like data.world for that. After setting up an an account and creating a new project, you can add your own sensor data using Add data > Add from URL.

Paste the following link: https://api.hackair.eu/hackair_data?access_key=1234 (replace 1234 with your own sensor’s access key). Add the extension .json to the file name, and you’re good. 

To enable automatic updates, go to project settings, and enable the Automatic Sync Options. You can then explore your data and build graphs like the one below.

Data.world alone will not give you graphs that you can permanently link to, but it’s provides good access to the API data. One option for building graphs is Google Data Studio. Log in and add a data source, adding data.world as a community connector. You’ll need the URL of your data.world project. To import all data from your sensor, add “SELECT * FROM <table_name>” as your SQL query. To be able to use the data, you’ll need to make a few adjustments:

  • date_str: set the type to Date Hour (YYYMMDDHH)
  • pollutant_q_value: set the aggregation to None

Now add two new fields and set both of them to aggregation = Average.

  • PM10 with the formula “CASE WHEN pollutant_q_name=”PM10_AirPollutantValue” THEN pollutant_q_value ELSE 0 END”
  • PM2.5 with the formula “CASE WHEN pollutant_q_name=”PM2.5_AirPollutantValue” THEN pollutant_q_value ELSE 0 END”

Now you can set up your report, for example using the time series chart or the data table. Play around – and when you’re done, you can share the link to your sensor data. Here’s the view of my recent measurements: https://datastudio.google.com/open/11iG_TgonCmPy0nFmUS0ObVWLudstQk4M

How about measurements from a specific geographic area?

You can download the latest measurements from a rectangular geographic area as follows:

  1. Determine the coordinates of the top left corner of your area, e.g. by locating it on OpenStreetMap and selecting show address. This will give you a pair of two numbers, the latitude (e.g.  52.6315 for Berlin) and the longitude (e.g. 13.1259 for Berlin). We’ll call them lat1 and lon1.
  2. Determine the coordinates of the bottom right corner of your area, e.g.  52.3153, 13.7569 for Berlin. Again, we’ll call them lat2 and lon2.
  3. Go to the following location: https://api.hackair.eu/hackair_data?location=lon1,lat1|lon2,lat2 (replacing the lon and lat variables with your actual values)

Now you can either add this link to data.world (as explained above) or transform it to a csv file using a JSON to CSV service (like Konklone.io/json). After you import or connect this data to Google Data Studio, you’ll again need to make a few adjustments:

  • date_str: set the type to Date Hour (YYYMMDDHH)
  • pollutant_q_value: set the aggregation to None

Now add two new fields:

  • with the formula “CASE WHEN pollutant_q_name=”PM10_AirPollutantValue” THEN pollutant_q_value ELSE 0 END”. Set the aggregation to average.
  • coordinate with the formula “CONCAT(loc_coordinates_1,”,”,loc_coordinates_0)”

You can now add a map to your report. Here are, for example, some of the latest measurements in the Netherlands:

Over to you!

  • What other ideas do you have to visualise and use the data you collect through hackAIR? Any cool tools we’ve missed?

My hackAIR story: Manuel from Berlin

Manuel Fricke was one of the first to set up a hackAIR home sensor in Berlin. He joined us last week at the hackAIR partners meeting for a conversation. Manuel works in the volunteer management department of BUND in Berlin.

Here is what he shared with us:

What motivated me to build my own hackAIR sensor? I am interested in climate politics, cycling and local politics. And: I wrote an article about hackAIR for BUND. That sparked my interest even more. I thought: this is cool! I can be the first in my network to build a sensor!

When I heard that BUND was offering sensor kits, I ordered one immediately. I wanted to build something and to use technology in order to learn more about my environment. I thought it would not be too complicated and it would not take too long.

Building the sensor

As a digital native, downloading the Arduino software was not difficult for me. I found out quickly that I had to turn off my firewall before I could access the different libraries. The labelling on the board to set up the cables was slightly different from the tutorial. But I managed to connect everything. When I started to build the sensor, I wasn’t aware that I would need a power supply outside. That meant that I needed to set up the sensor in my backyard. I would have preferred to have it at the front of my house with the busy traffic, but I could not get a power cable through my window there. For the sensor casing, I chose the plastic bottle. It works fine.

After following the steps as explained in the tutorial, I was not sure whether my sensor was connected. It was trial and error. When I finally connected my sensor to the hackAIR platform, I could see data in my profile and on the map. Measurements in my profile are always up-to-date, that is great. On the map, there is currently a delay: it shows measurements from two days ago. That needs to be fixed.

I tried to export the sensor data, it has not worked yet. I have seen that the sensor collects data on air pollution, humidity and temperature, but those values are not being displayed. It would be really interesting to have access to all the data.

How to use the air quality data

I’d like to see my sensor data being used by researchers and to talk to others in my neighbourhood about the traffic in our street. Especially the morning commute brings a lot of cars, because people take side roads and everything gets blocked. You can smell and hear them. At the same time, everyone opens their windows to let ‘fresh’ air in, and children walk to school. It would be great to set up a bunch of hackAIR sensors to monitor those peaks of air pollution.

As a cyclist, I want to explore how such measurements can support my own viewpoint also on a political scale. Better infrastructure for bikes would mean less cars on the road and less pollution.  

What’s next?

I have been sharing information about hackAIR with my friends, and I will order a second kit to set up another measurement point. My tip for hackAIR: involve young people! Invite teenagers who are interested in computers. It is easy enough and still challenging enough. hackAIR has potential: just get the kids engaged!

What I really like about hackAIR? It is cool – new – nice design – for me very inviting! It is fun, not too hard to assemble, not very high-tech. And it is a great way to let people know about the issues of air quality in cities.

Thank you, Manuel, for your engagement! And thank you, Arne Fellermann and Lisa Bieker from BUND, for inviting Manuel to our meeting.

Build your own sensor: hackAIR in action

While it is possible to contribute to a better air quality map on your own, it’s a lot more fun to do so in a community of people. That’s why we’re travelling across Europe to participate in and organise workshops and activities on air quality and citizen sensing: Have a look at some recent events in Germany, Belgium and Norway!

Linking up at Open Data Day

Open Data Day is an annual celebration of open data all over the world: 406 events took place on March 3, 2018! It is an opportunity to show the benefits of open data and encourage the adoption of open data policies in government, business and civil society.

hackAIR was partner of the Frankfurt Hackathon, and hackAIR team members Arne Fellermann (BUND) and Carina Veeckman (VUB) also contributed to Open Data Day events in Stuttgart and Brussels.

Arne travelled across Germany on March 3 (Berlin to Frankfurt to Stuttgart and back) and participated in two Open Data Day events: at OK Lab Frankfurt and at OK Lab Stuttgart. He concludes:


“Great communities of OK Labs, inspiring talks and input. Great to discuss the activities of luftdaten.info. We also received valuable and constructive feedback on hackAIR.”


The Open Data Day event in Brussels (“Towards clean air with open data”) was organised by Open Knowledge Belgium and Civic labs. All resources are available and open for everyone to use: presentations, videos and pictures. Carina Veeckman (VUB) spoke about: “Participatory processes for air quality measurements through hackAIR”. Carina’s presentation slides and the video of her talk give a good overview of the work of hackAIR in the field of air quality measurement and citizen science. She says:


Open Data Day was celebrated in Brussels with an event fully dedicated to open air quality.

The event was a great networking opportunity for hackAIR to strengthen collaborations, and make new contacts.”


Build your own sensor: workshop by NILU

 On March 1, hackAIR partner NILU organised a sensor-building workshop in Oslo. 16 people showed up, from high school students, civil servants of the municipality of Oslo, students of meteorology and environmental activists. After building the hackAIR home sensor, they set them up in simple cases (thanks to luftdaten.info for providing fantastic ideas), with the following adaptations:

  • conductive silicone tube (10 cm) to avoid particles to be attached/accumulated inside the tube
  • sensor mounted on the vertical part of the PVC pipe to facilitate the air flow
  • extra part to the PVC pipe added to avoid sensor falling down


The sensors will now be set up across Oslo and operate until June to increase our collective understanding of air quality patterns in the Norwegian capital.

Want to organize your own hackAIR workshop? We’ve got a full workshop toolkit with all instructions for you – or give us a shout, and we might even come by!

Organise your own hackAIR workshop with the hackAIR workshop toolkit

Are you interested in organising a workshop on air pollution and grassroots air quality monitoring –  for your neighbourhood, school, organisation, city council?

Check out the hackAIR workshop toolkit: it is easy to use! And, of course, you can tailor the content to your needs.

In this toolkit, the hackAIR team walks you through the whole process of planning and organising your own hackAIR workshops. All resources are compiled for you – ready to go.

Four modules are available:


The toolkit supports you before, during and after a hackAIR workshop.

Before:

During (for each of the four modules):

  • Facilitation guide
  • Presentation slides 
  • Handouts

After:

The workshop modules can be used separately. They can also build on each other, depending on purpose and context. Several teachers have already told us that they are thrilled to bring hackAIR workshops to their classrooms!

Let’s talk. We’d love to hear from you how you are using the hackAIR workshop toolkit!

For support with workshop facilitation or if you would like to invite hackAIR to present at your event: please get in touch with us. We’ll explore together what is possible.

For Norway-based blog readers: you are invited to participate in a workshop organised by hackAIR partner NILU in Oslo on Thursday, March 1. Information about this event is here.

And of course: please send us information about your upcoming events. We will spread the word through our communication channels!

Local air quality campaigns: Learning from UrbanAirQ

Air pollution is most importantly a local issue. Have you been wondering how to engage your neighbours, how to collect data together and to make sense of the results? UrbanAirQ is an inspiring example for a citizen-driven local air quality campaign.

 One of the Dutch pilots of the Making Sense project  – UrbanAirQ – involved the local community of the two most polluted streets in Amsterdam. Through online and offline recruiting, a group of 25 local residents and a number of experts participated in the case study.  


The main questions at the start were: How can we bring together engaged citizens and experts to explore the opportunities of participatory air quality monitoring? Can this collaboration identify challenges and issues to be tackled? Will this project improve the quality of life of these local residents?

The local residents were in charge: they decided what they wanted to measure and why. Their questions varied: some wanted to know more about differences from street to street and from door-to-door; others were interested in the  different levels of air pollution between the ground floor and the sixth floor of the same building.


Participants received an air quality sensor that could generate data to answer these questions and placed them in the best locations to address their questions.

The sensors were calibrated with the help of technical experts, using the official measuring stations. Data generated during the three-months-pilot were analysed with the support of experts from the Dutch national weather service (KNMI).


One participant placed two sensors: one on the front side of her house, one in the backyard. She was very interested to learn more about the level of air pollution in these two locations because she wanted to choose where she would spend her free time outside. With the data and new information from the experiment, she was able to make an informed choice about where to go. With the data from the sensors, citizens could find the information they were interested in and change their behaviour to take better care of their health and well-being.

The project inspired a start-up, called Treewifi. Air quality sensors are placed into birdhouses and hung into trees in cities. If the air is clean, free WiFi is offered to passers-by. Data is hyper-local, high-quality and real-time.

Expect to be surprised by what a community-led citizen science project can bring as short and long-term outcomes!


Partners in this project were the Dutch national weather service (KNMI), University of Wageningen, Public Health Service of Amsterdam (GGD Amsterdam), Dutch Energy Research Center (ECN), LongFonds, Waag Society and Amsterdam Institute for Advanced Metropolitan Studies (AMS).

If you want to set up a local air quality campaign, you can find instructions to build your own hackAIR sensors at our tutorial page – and check out the Making Sense toolkit for lots of methods, tools and practices. Very inspiring resources for hackAIR users who want to design and implement air quality measurement campaigns in their local communities!

Copyright 2021. All rights reserved

Take part in this short survey and help us improve your hackAIR experience.