hackAIR home sensors made easy for you

Do you want to measure air quality where you live? Have you thought about building your own air quality sensor, but found it too much hassle to get the materials and handle the tech?

We’re proud to present the first ever plug-and-play hackAIR home sensor set!

Here is our offer: order a hackAIR air quality home sensor and receive all you need, already soldered, assembled AND pre-programmed for you.

No collecting separate pieces from different stores, no need to deal with customs – and: no fussing around with a soldering iron. No confusion about which wire needs to go where. And you don’t even have to download software to get started.

We have a limited amount of sensor sets and expect to sell out quickly. Make sure that you get your sensor – by ordering today.


Capabilities of the hackAIR home sensor

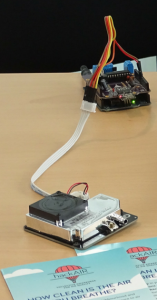
The hackAIR home sensor measures particulate matter concentrations (PM10 and PM2.5) using a low-cost sensor called SDS011. Every five minutes, you will be able to see a new measurement from your location on platform.hackair.eu – and you can compare it with other measurements from your neighbourhood (including from official air quality sensors). You can also download and analyse your measurements to get a sense of how air quality changes over time.

The hackAIR home sensor kit

We have purchased, assembled and programmed the main components for your hackAIR sensor. What you need to do is to add a sensor case (e.g. using an empty plastic bottle) and find a good spot for it within reach of your WiFi network (and a power cable).

You will also need to register your sensor on the hackAIR platform and connect it with your WiFi. You’ll be up and running in no time.

This is what you get in your package:

  • Air quality sensor: Nova PM SDS011
  • Microcontroller (Wemos D1 mini) with attached temperature and humidity sensor (DHT22)
  • All necessary jumper wires and a plastic tube to draw in air
  • Tutorial: How to set up your sensor
  • hackAIR sticker

What you need to add:

  • Micro-USB cable and USB charger (maybe a spare one from an old phone?)
  • A case to protect your hackAIR sensor from rain – this can be a yoghurt bucket or a PET bottle or plumbing pipe… Get creative! Find inspiration here
  • Access to electricity and WiFi to connect your sensor

You are ready to rock with this set!

And: let us know how it goes. If you need support, ask us. And: we are curious to see pictures of your sensor (+ cases). Share your images on social media and tag hackAIR!

hackAIR – Behind the scenes

What might happen when you put three soldering irons – hundreds of wires – air quality sensors – temperature sensors – Wemos microcontrollers – plastic tubes – a computer – foldable cardboard boxes AND five dedicated humans in one room together for one day?


A few hours later, 3168 pins were soldered – 396 wires connected – 99 Wemos microcontrollers programmed – 99 hackAIR home sensors assembled – 99 cardboard boxes folded and packed.

The resulting stack of 99 hackAIR home sensors is now waiting to be adopted, one citizen scientist at the time. Have you always wanted your own air quality sensor, but were afraid to fiddle with electronics and programming? This is your chance.

We’re proud to announce the first ever plug-and-play hackAIR home sensors. Stocks are limited. If you want one, hop on over to this page

Pollution Explorers – Wearable technology to map subjective perception of air quality

Updated in December 2018 with the final project report

Are humans as good as sensors for mapping air quality? Or, in more elaborate words: can we measure air quality through our innate subjective perception? Read on to learn more how these questions are guiding the project “Pollution Explorers”.

What is Pollution Explorers about?

Pollution Explorers is a participatory project exploring air quality issues through people’s subjective perception and wearable technology. The project team hosts workshops in local communities and schools. It is an artist residency led by Ling Tan of Umbrellium in collaboration with hackAIR. Pollution Explorer is building on the results of a long-term initiative by Umbrellium: WearAQ.

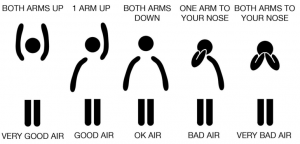
As “pollution explorers”, workshop participants take a walk through their neighbourhood to map air quality in two ways: through their own perceptions and through a mobile air quality sensor. Their subjective experience of the air quality is recorded using low tech wearable devices that catalogue their body gestures. The wearables are integrated in a coat (see image above). These coats are easy to put on, for adults as well as for children. Here are the body gestures:

Using machine learning algorithms and correlation techniques, the data from the wearable devices are compared with measurements and datasets relating to air quality from public data sources such as London Air Quality Network and Thingful.net. The data are also compared to the measurements of the mobile air quality sensors that are used during the walk.

Following the walk, participants reflect in a group conversation on how to describe air quality. In a third part of the workshop, they are invited to think about what they can change in their own behaviour to tackle air pollution (see the pledge card below).

Pollution Explorers​ provides a new way of understanding air quality issues through perceptual experience mapping. By looking at the field of citizen sensing from the viewpoint of wearable technology, the project is adding very valuable additional data and perspectives to the hackAIR project.

Watch the video to see the “Pollution Explorers” in action!

After six workshops, we’ve seen the following:

  • Humans are very good at perceiving extreme changes in their environments. While people may not always correctly perceive air quality, they are good at telling if it is better or worse than a location they were at before.
  • Children are very sensitive to momentary changes in the air around them, such as a truck or car driving by, and adults tend to be more holistic about how they perceive the air around them, less influenced by momentary changes.
  • It is more challenging to describe bad air quality than good conditions. In their conversations during the workshops, participants came up with new words:

    • bad air: close, still, smoky, muggy, chokey, exhaust, cementy, gutty, diesel, hot
    • so-so air: fragrant, lukewarm, bbq
    • good air: pastoral, green, warm, grass-fresh, cool, windy, calm, crisp
  • Participating in a workshop about monitoring air quality and citizen sensing supports people to commit to change their behaviour for a certain time period. Here is a pledge by one of the young participants:


Interested in reading more about the learnings of the Pollution Explorers project? Here is a project report, written by Ling Tan.

Pollution Explorers in pictures


  _________________________________________________________________

Pollution Explorer is an artist residency led by Ling Tan of Umbrellium in collaboration with hackAIR, funded by Vertigo STARTS, supported by FutureEverything. Photo credits for all images in this post: Umbrellium

Take part in the hackAIR summer photo contest

What is the contest about?

Send us a picture of the sky where you are currently spending your summer – using the hackAIR app. You’ll get a quick estimate of the air quality at your location – and the best pictures will win a hackAIR air quality sensor!
In your picture, we want to see what air quality means to you: be it good, bad or ugly, close to your home or far away. Where do you encounter good air quality? Where is it bad? Remember to always include a portion of the (cloudless) sky – so that we can give you an air quality estimate.

We are really excited to see your contributions!

Participating is super easy

Here is what you need to do:

  • If you haven’t downloaded the hackAIR app yet, do that right away here.
  • Find the right spot and timing for your photo!
  • Remember not to take pictures close to sunrise or sunset (as this makes it challenging for the platform to analyze your photo).
  • Here is more information about the sky photo feature of the hackAIR app

Rules

  • Every sky photo submitted through the hackAIR app between now and the end of August will enter the contest.
  • You can upload as many photos as you wish.
  • A jury of hackAIR partners will decide on the winning photos in early September.
  • You will receive an email when you are one of the lucky winners!
  • You are giving hackAIR the right to publish your uploaded photos through the hackAIR website and hackAIR social media and newsletter.
  • We will publish the winning sky photos in our September newsletter.

Prizes

  • The jury will choose three winners.
  • The first winner receives two hackAIR sensors: a mobile sensor AND a home sensor. The second prize is a mobile sensor. The third prize is a home sensor.

Better air for all: air quality and health

Air pollution is not just an environmental issue: it can reduce people’s lifespan and cause serious heart and lung disease. We talked with Giuseppe de Carlo (Director of Operations and Projects at the European Federation of Allergy and Airways Diseases Patients Associations – EFA) about health effects of air pollution. EFA is a non-profit network of allergy, asthma and COPD (Chronic obstructive pulmonary disease) patients’ organisations, representing 42 national associations in 25 countries and over 400,000 patients. Here is what we learned:

Health effects of air pollution

Research over many decades has highlighted the extent of the effects of outdoor air pollution on the respiratory system. Even short-term increases in air pollution have been associated with respiratory symptoms and temporary decreases in lung function.
According to the Organisation for Economic Co-operation and Development (OECD), air pollution will be the biggest environmental cause of premature death by 2050. These pollutants increase the death rate, especially in sensitive population groups such as the elderly and children, or those suffering from respiratory diseases. It is estimated that poor air quality in Europe leads to an average loss of 8.6 months’ of life expectancy.

Scientific studies show the link between the development of lung diseases and air pollution. Particulate matter plays a role in the development of allergic asthma, including in children, as well as in triggering exacerbations of asthma. A recently published study states: “Exposure to air pollution early in life might contribute to the development of asthma throughout childhood and adolescence, particularly after age 4 years, when asthma can be more reliably diagnosed. Reductions in levels of air pollution could help to prevent the development of asthma in children.”

You can read more about the links between air pollution and health on the EFA website.

EFA is also collaborating with the European Respiratory Society. Interested in more background reading? Check the resources from ERS on air pollution – a great compilation of articles and materials!


Advocating for better air in Europe

“We need better air!

9 out of 10 European citizens breathe polluted air. This is not acceptable – and: it is getting worse and worse. People are more and more moving to cities from the rural areas. The situation in cities regarding air quality is not improving.”

Roberta Savli (Director of Strategy and Policy EFA, May 2018)

EFA is planning a campaign to raise awareness about the need for better indoor and outdoor air quality in the preparations for the elections to the European Parliament in 2019.

The European Respiratory Society issued the following recommendations for policymakers:

  • European countries must support the implementation of the WHO recommended air quality guidelines for outdoor and indoor air – through an ambitious revision of limit values for ambient air pollution.
  • European countries should reinforce their efforts to reduce source pollution from all sectors – industrial, transport and energy.
  • European countries should make air quality an integral part of their transport, industrial and energy policies and ensure that the correct level of governance – national, regional or local – is equipped to tackle sources of pollution. States also need to improve cooperation on cross-border pollution and ultimately must undertake to implement and enforce air quality legislation.

You can read more in the ERS White Book on air quality.

EFA coordinates the Interest Group on Allergy and Asthma in the European Parliament, together with EAACI, the European Academy of Allergy and Clinical Immunology. This Interest Group meets twice a year. This group plays an important role in advocating for better air in Europe.

EFA project MyAirCoach

EFA collaborated in a project that developed an app, specifically designed for patients with respiratory diseases: MyAirCoach. A prototype for a device that measures indoor air quality has been built: PM 2.5 and PM 10, NO2, pressure, temperature, humidity. The app also shows outdoor air quality. MyAirCoach is using the sensor measurements only as a source of information at the moment. It does not provide recommendations for changing treatment according to external factors. That could be a second step, but the recommendations need to be very accurate for that.

About hackAIR

Giuseppe is a member of hackAIR advisory board and has been engaged in hackAIR from the beginning:


“I find the hackAIR platform and app very easy to use and useful. I built a sensor, and it is indeed easy although I am not a very techy guy. In terms of the process and how the system has been designed and developed: the final outcome of hackAIR is very good!”


hackAIR is intended for citizens in general. EFA is working with people with asthma, allergies and respiratory diseases. These diseases are linked to air pollution. It would be interesting for the EFA network if it would be possible to select specific parameters (including humidity). The patients would then receive information about their individual selection. The impact of environmental factors on their health condition is different for each asthma patient. Giuseppe said: “It would be great if air quality applications like hackAIR could provide options to personalize the information more.”

Giuseppe added: “One of the things that I like the most about hackAIR is the engagement with citizens: raising awareness about the topic. Also is important is the focus on behaving in a different way. These are issues that our patient network is involved in. They relate to our work on empowering patients to self-monitor. Changing behaviour is sometimes quite a challenge. Let’s talk further how hackAIR and EFA can collaborate and support each other’s work!”

My hackAIR story: Kyrre Sørensen from Bergen (Norway)

Hundreds of people across Europe have set up hackAIR sensors in the past months. Behind each of the sensors is a story – about air pollution and why it is of concern for us. We asked Kyrre Sørensen from Bergen in Norway why he set up his hackAIR sensor:

“Traditionally we had problems in Bergen with air quality. All the roads in the regions go through the inner city here, and the mountains surrounding the city keep fresh air from coming in. In Norwegian, we call this situation giftlokk (“poison-lid”). It gives us an inversion that traps air pollution and smog close to the ground.

Together with the green movements and the local green party, we wanted to do something about the situation. For that, we first needed more data to find out why, when and where the giftlokk is worst, and what we can do to stop it and warn people.

Official air quality data was not enough: the city had only set up five expensive sensors, only two of them downtown where the problem is the biggest. With hackAIR, we are hoping to monitor that better. We can set up more sensors – also mobile ones that we can use to identify where air pollution is worse, and what the source is.

Chasing the source of air pollution in Bergen

As we mostly use electricity for heating, and the winter is not that cold in Bergen, we were curious: Could the problem still be that some heat their houses with firewood or with oil, like some big buildings do?

Could it be cars? Our region is rapidly changing to electric cars: every second new car is now either electric or a plug-in hybrid. 17 % of the cars passing the toll roads are now electric. But we use winter tires, could that be the source of the particles? Bergen is also famous for its rain, and that causes many to use cars instead of umbrellas.

Bergen is also the biggest cruise port in Norway. On some days we have five big cruise ships with up to eleven thousand tourists. Could that also cause the problems?

Using data to find the cause of air pollution

I wanted more data, so I ordered a hackAIR home sensor early, and helped to organise a workshop in Bergen. Before the workshop I ordered the hackAIR mobile sensor. My first one got destroyed in the process of soldering, but I got a new sensor working. I now have 3 sensors working, one centrally in Bergen, one waiting to be placed somewhere, and one mobile one, currently brought with me on summer vacation.

It’s really hard for normal people to solder their own sensors, and it is still too difficult to programme sensors and check data. Why not just one sensor to connect to your phone without anything else to do? What would it take to sell pre-built ones? (Ed: hackAIR is looking for commercial partners that might want to take this on – talk to us!)

My political party might buy a lot of sensors to hand out or lend out to those applying or living in interesting places, for example near the cruise-ships. We will need pre-built ones to make sure they all work as they should, and to be sure they will be ready to set up.

So many ideas, so much work to do…

There are so many ways in which the hackAIR community could use their data more. Like twitter-bots warning when the air is bad, daily reports of the last days or the most beautiful graphs to spread on social media.

More open data with easier access would also mean that we can implement more cool ideas, like you get a message when your local or own sensor drops to bad quality, when its not sending data, etc.

The app should store data on a file on your phone, so other apps, like IFTTT or other automatic trigger-programs can use it. How about a widget or background image changing according to your and others air quality data? You could for example make your phone led-light change according to your sensor data, that would be cool.

How do I make graphs from my data more easily than with cumbersome exports? Can hackAIR do it for me, and have it post to my social media for me?

And how can I share my data in txt to everyone? Instead of the API calls, we could have hackair.eu/sensorid/latestweek.txt or a graph as an image like /sensorid/24hgraph.jpg. At the moment, my friends cannot access data from my sensor and analysing data from a specific geographic region is difficult. I want this to be easier.

I really love hackAIR, and am wondering what will happen with the platform when the year is done. I am no researcher, but I would love to help it develop further. We should just try to place as many sensors as we can, to give researchers and other interested parties useful data to find out more about the particles we breathe in every day. We could also have 500 sensors to send to areas that are affected by events that need monitoring, like a volcanic eruption, big forest fires and similar unforeseen events.

Overall, 10 000 sensors in Europe before 2020 should be the goal!”

Five steps to better understand air quality in your neighbourhood

Step 1: Get informed

  • Check out resources that provide general information about air quality and about mapping air quality through citizen science. You can find a lot on our website. For information tailored for your neighbourhood: have a look at local newspapers, social media channels and local initiatives.
  • Find out where your nearest air quality monitoring station is (official or citizen-operated). You can use the hackAIR platform for this purpose.
  • Observe how air quality changes over time: We’ve described how to plot a time series of hackAIR sensor data. For Germany, you can find great visualisations of official air quality measurements at smogalarm.org.
  • If you want to compare the measurements to the official limit values for air pollution, you’ll need to look at the daily average of your measurements. Generally, daily averages above 50 µg/m³ for PM10 or 25 µg/m³ for PM2.5 can be a cause for concern.

Step 2: Observe in your neighbourhood

Take time for some walks or bike rides. Pay attention to the following details:

  • Where are regular traffic jams? What changes during rush hour? Where do you see idling because of traffic lights, road works or around schools?
  • Are there industry sites or large agricultural activities close to your neighbourhood?
  • What is the main source of heating that you and your neighbours use?
  • Which sources of air pollution are important in the area where you live (e.g. transport, industry, agriculture, wood burning)?

Step 3: Connect with others who are interested in mapping air quality

  • Find initiatives working on air quality in your neighbourhood or in your city (keywords for online search: air quality + name of your city; climate, mobility, smart cities…)
  • Local can mean: your street, your larger neighbourhood, your village or your city.
  • Take part in (or: organize) a roundtable conversation on air quality in your town.

Step 4: Learn from others

  • Find inspiring initiatives in other cities or countries.
  • You can check out best-practice examples on our blog and explore the Making Sense Toolkit.

Step 5: Contribute to mapping air quality in your neighbourhood

We are looking forward to hearing from you – what are you learning? What has surprised you? Get in touch with us, share your stories!

Report: Build your own air quality sensor – in Brussels

In June, the hackAIR team moderated 7 sensor-building workshops across Europe. More than 200 interested participants learned more about air quality and built their own sensor. Here is the first report from this amazing month, featuring the workshop in Brussels on June 13.

Air quality is a “hot” topic in Brussels and all across Belgium: in citizen activist groups, in stakeholder consultations, in policy making and in the media. There is a huge demand for more low-cost air quality sensors to be set up in Brussels. This event was co-organised by a broad range of partners: Influencair, Open Knowledge Belgium, Sandbox VRT, BRAL, Civic Lab Leuven, Luchtpijp, BeCentral, hackAIR. hackAIR was represented by VUB, Crevis and ON:SUBJECT.

It was the largest workshop so far for hackAIR: 100 citizens came – and many more had wanted to participate (no worries: there will be more workshops in Brussels in the next months!)

One of the participants shared about her motivation to build her own air quality sensor:

“I live in an apartment on a busy road in the middle of Brussels. I am very concerned about the impact of air pollution on my health. I want to measure the air quality where I live, with my own sensor. I want to make sense of the data that I will collect. Knowing more about the levels of pollution over time, will make it easier for me to decide whether I can stay in my current appartement. If the air is too bad here, I will move to a neighbourhood with healthier air.

It was amazing to learn more about the diversity of the participants in conversations around the assembling tables. The age range was from 11 to 65+. There were concerned citizens, scientists in the field of air quality, medical doctors, policy makers, journalists, social entrepreneurs, innovators, open data experts, members of grassroots air quality initiatives (such as Filter Cafe). People came from Brussels and neighbouring municipalities, and also from across Belgium. A mix of French, Dutch and English could be heard in the lively conversations.

The sensors had been prepared by the Open Knowledge Belgium tech team. They did a great job in providing a “plug-and-play-sensor”: everything was already soldered. The participants just had to add four screws and connect a few wires. An easy and very fast experience of building an air quality sensor! Following the assembling phase, each participant was supported by a member of the tech team to connect his / her sensor to the luftdaten platform. There was only one last step to take at home: configuring the sensor with the home WiFi. With the step-by-step manual that was handed out, this was surely easy. Two weeks after the event, the vast majority of the sensors are up and running! 


During the workshop, participants were invited to take part in a survey conducted by the hackAIR partner VUB. This survey is part of the hackAIR overall project and explores the connections between engagement in activities about air quality and potential change of behaviour.


Our thanks go to all our partners who helped to make this workshop happen, to all who volunteered their time to support participants during the assembling – and of course to all who came and built their own sensor!

Stay tuned! We’ll spread the invitations for upcoming workshops on our events page and through social media. Also keep in mind: you can invite the hackAIR team to offer a sensor-building workshop in your neighbourhood or for your organisation. Or: you can organise your own workshop with our workshop toolkit

Towards clean air for green cities: A Green Week Report

Green cities do better. They are healthy, with clean air, green spaces, safe drinking water, and offer a great quality of life to the people that live there. EU Green Week 2018 explored ways in which the EU is helping cities to become better places to live and work. Local authorities and citizens were invited to share their vision of a sustainable future.

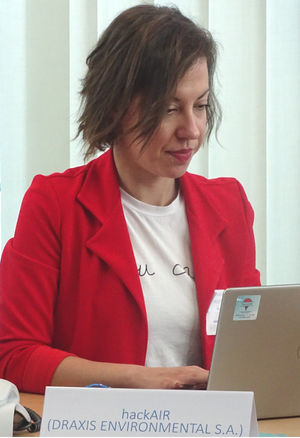
Panagiota Syropoulou (DRAXIS) presents hackAIR at the EU Green Week 2018

We presented hackAIR at a full-day networking event during the EU Green Cities Summit in Brussels: Involving citizens in air quality monitoring through Citizen Science initiatives. Together with other initiatives such as iSCAPE and Ground Truth 2.0 we discussed how low-cost air quality monitoring can help provide real-time data and engage citizens in environmental monitoring.

The role of citizen engagement was highlighted throughout as central to delivering the promise of green cities. We heard stories of sustainable urban development, health and waste management in the panel session Towards greener cities: citizens as drivers for change  (link to video recording). Citizen science in particular is achieving environmental policy impact on diverse topics such as air quality and flooding (see the video recording of Making our cities green with Citizen Science for the full discussion).

One of the inspiring examples of the power of large-scale citizen science presented during Green Week is Curieuze Neuzen (Dutch for: Curious Noses). 20.000 citizens measured air quality in Flanders (Belgium) in May 2018. The project team found that citizen science is a powerful tool to raise awareness and get information across about environmental problems. In order to reach those who are not the “usual subjects”, simple and robust methods of data collection are needed. The Curieuze Neuzen campaign collaborated with print media, TV, radio and ads in public transport.

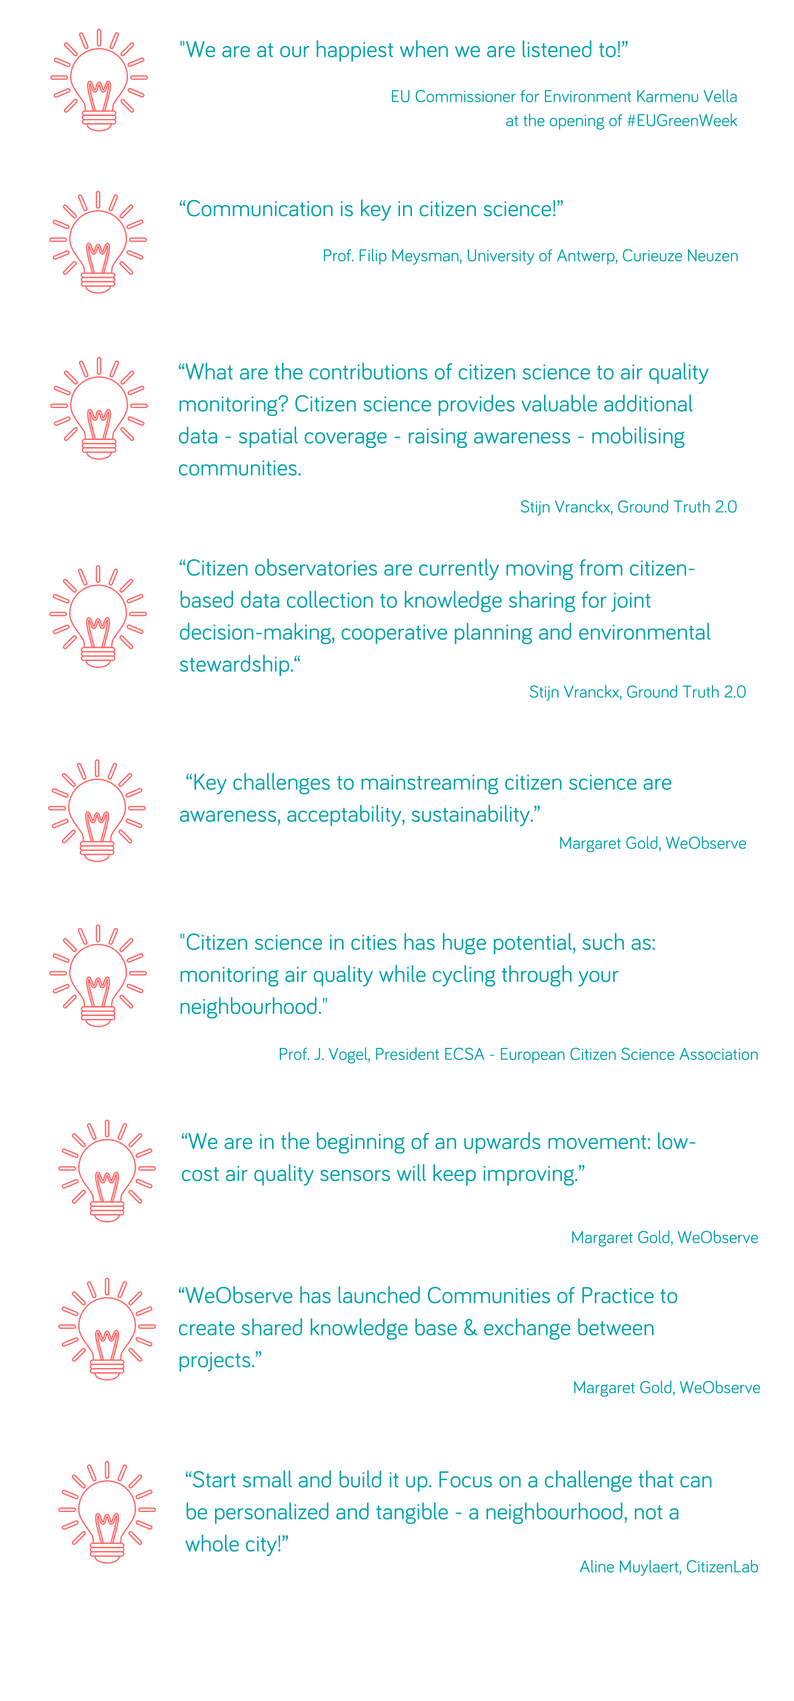
Some highlights of the EU Green Week about air quality and citizen science in quotes:

hackAIR’s hidden features

Did you know…

  • that hackAIR calculates air pollution estimates for locations without measurements to create a continuous map in Germany and Norway?
  • that it’s possible to estimate air quality using just a picture of the blue sky?
  • that hackAIR uses machine learning algorithms to collect suitable images and can estimate the location where a sky photo was taken?

You can find more information about air quality estimation from sky images in an earlier blog post. Today, we want to introduce you to the following features:

  1. Data fusion mapping
  2.  Image collection and analysis

hackAIR contributes to the growing field of participatory air quality sensing, with the aim to improve air quality data in Europe. hackAIR is accessible – citizens can choose their own level of contribution, reaching from a one-off, simple engagement to high involvement and long-term measurement and data analysis. Users who register on the hackAIR platform can see more features and have a more personalized experience: they receive personal recommendations depending on preferences chosen in their user profile.

Data fusion mapping

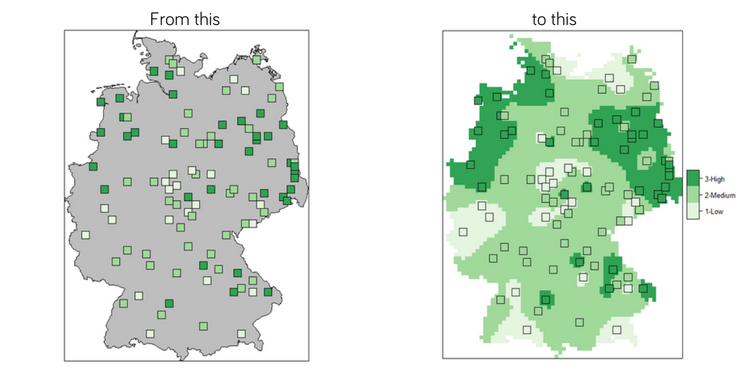
In hackAIR we collect mostly point-based observations, through air quality sensors and sky photos sky. For hackAIR users, we want to offer personalized  information about air quality at every location and visualize these observations as a spatially continuous map.

The data fusion module has been running since August 2017. It currently provides hourly updates of the average air quality for the last 24 hours. When we compared the module index with data of official measuring stations, we found a good correlation (R = 0.72, 74% correctly classified). We provide estimates for each 5x5km square in the target countries.

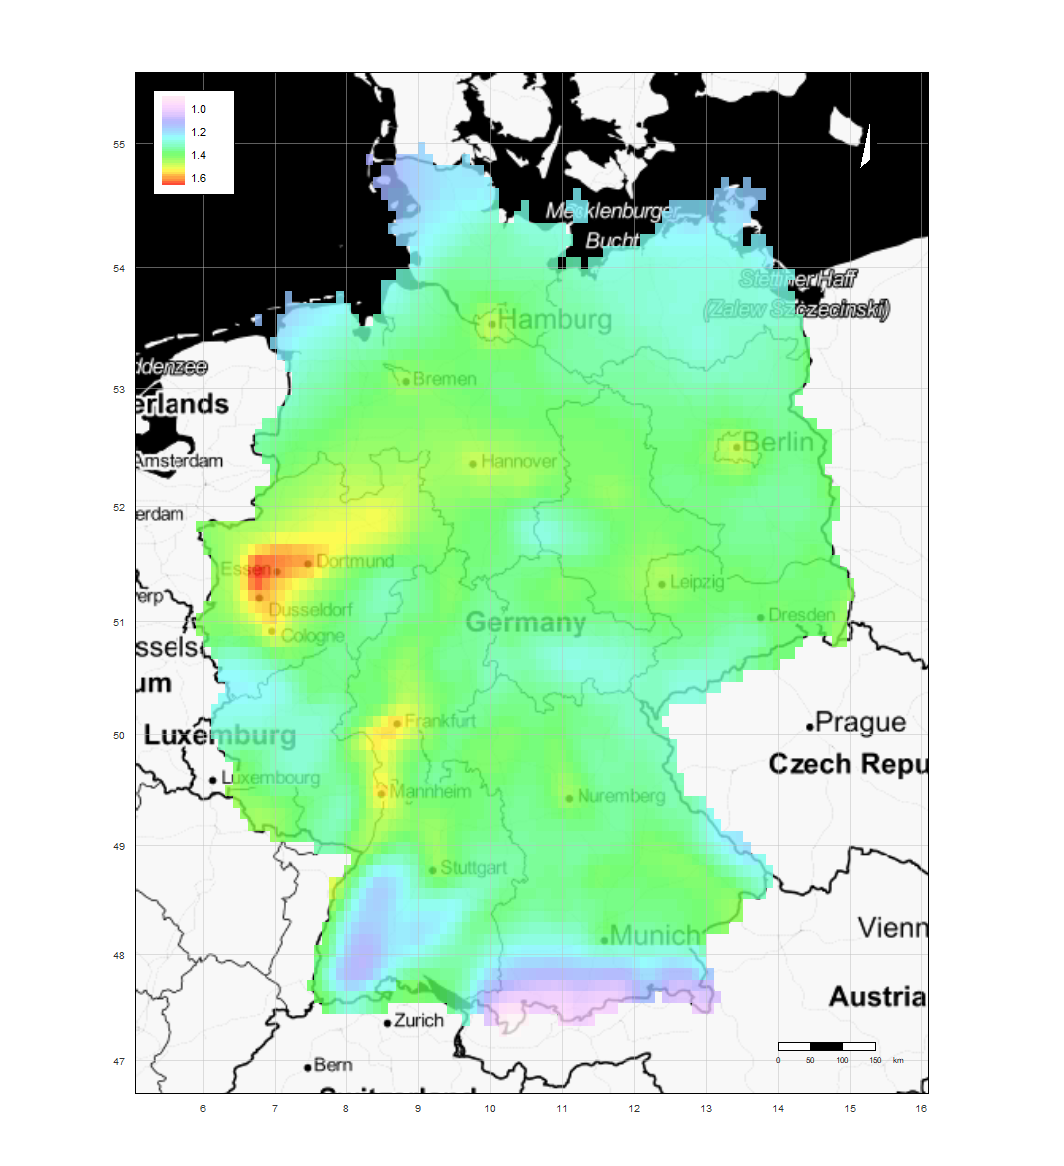
The image to the right shows the average air quality in Germany between September 2017 and February 2018 – overall a very realistic pattern. Pollution hotspots in the Ruhr area and other metropolitan areas are visible, and larger forests and nature reserves can clearly be identified.

On the hackAIR platform, the fusion map is currently hidden. Switch it on by clicking on the little balloon icon and zoom out enough to see the spatial patterns in Norway and Germany.

As mapping air quality at urban scale requires a dense network of sensors with high-quality data, NILU is planning experiments for Oslo later in 2018. The hackAIR pilot partner NILU has been offering workshops to citizens in Oslo to build their own sensor. This will allow to create a network of hackAIR sensors in Oslo in order to map the air quality on street-level.

In the video below, NILU’s Philipp Schneider explains the science behind hackAIR’s continuous air quality map.

Image data collection and analysis

hackAIR integrates several sources of air quality monitoring: official data, open data and APIs. Thanks to a good collaboration, hackAIR also shows the measurement of Luftdaten-sensors across Europe.

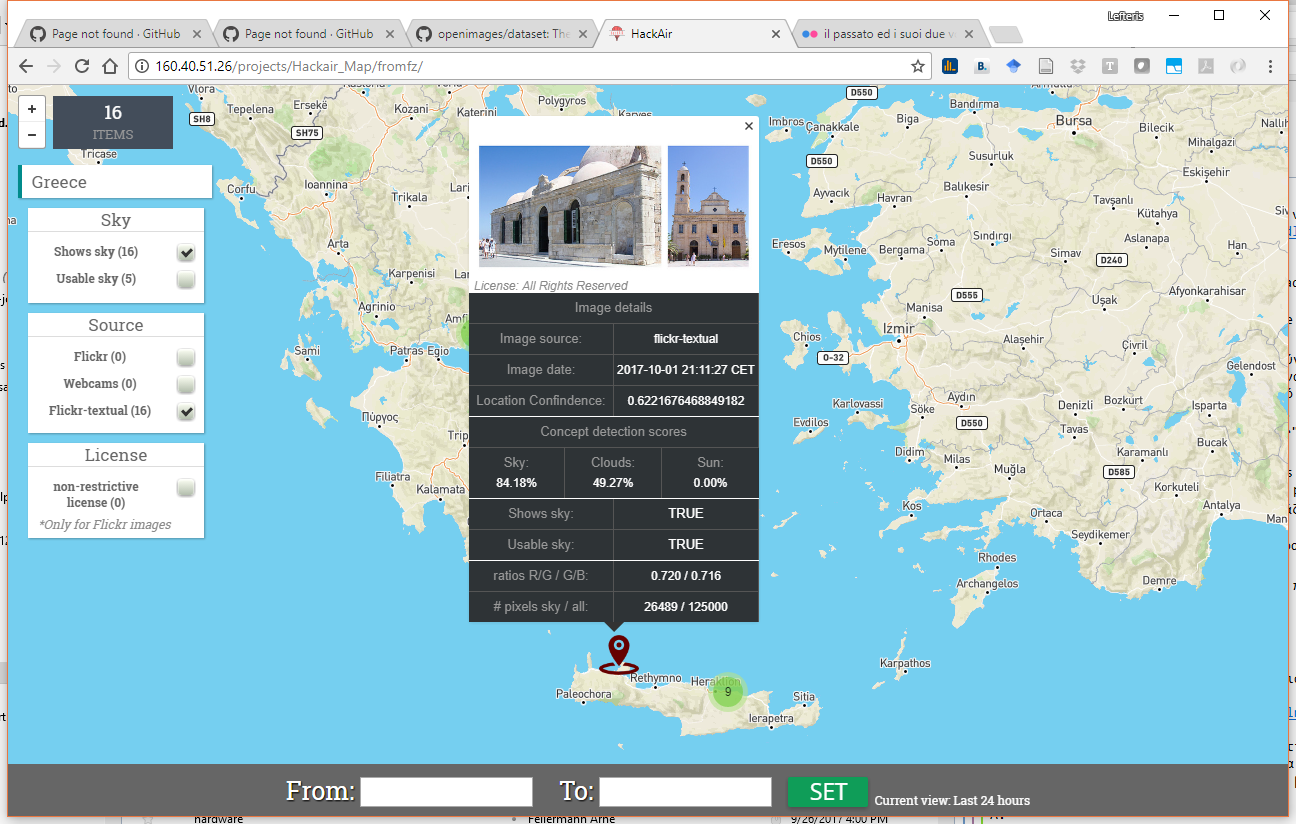
To supplement user-generated photos submitted through the hackAIR app, hackAIR collects sky images from Flickr and webcams. As there are many images on Flickr without a tag for location, the hackAIR team has developed a machine learning algorithm to estimate the location through using the image metadata (such as title, tags, description).

Image not geotagged but clearly from Chania/Crete/Greece! Tags: Chania, architecture, building, sky

In a second step, the algorithm detects the portion of blue sky in the photo. As the lower parts of photos often show buildings or landscape, this part is discarded by the hackAIR system. From the recognized sky, the upper third is used for further analysis.

Sample sky detection using three different algorithms

In the video below, CERTH’s Eleftherios Syromitros-Xioufis explains the science behind hackAIR’s image data collection and analysis.

Want to try out hackAIR’s air quality detection from sky images? Download the app and upload a picture of the sky near you to get an estimate.

Copyright 2021. All rights reserved

Take part in this short survey and help us improve your hackAIR experience.