hackAIR’s social media monitoring tool

Keeping track of conversations and finding good people to follow on social media can be hard. Within hackAIR, this task has now become easier: CERTH has developed an easy-to-use web-based tool that enables real-time monitoring and analysis of a variety of popular social media platforms with open APIs (Twitter, Facebook, Google+, YouTube). This helps us discover online communities and accounts related to air quality and track the impact of our dissemination activities on social media.
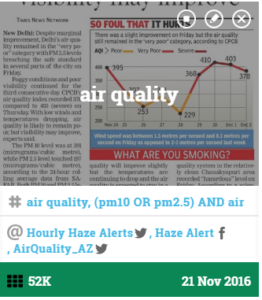
The tool is configured to keep track of content that is posted around specific keywords and/or accounts of interest. In the context of hackAIR, we use keywords and accounts related to air quality but in principle, the tool can be used to monitor any type of keywords and accounts (e.g. the name of a brand and a number of accounts that often post messages related to this brand). Once specific sets of keywords and accounts (“collections”) have been specified the tool starts pulling related content from the social media platforms on a regular basis (every 15-30 mins) and creates a browsable stream of social media items (“feed”).


The feed view also enables filtering of the items by keyword, source(s) (e.g. show only Facebook and Google+ posts), language, topic (facilitated by text clustering methods), type (media/text) and date range. The items can also be ranked by recency (i.e. the most recent posts first) or popularity (e.g. post with the largest number of shares first). In addition, it is possible to filter redundant items (items with nearly identical content).
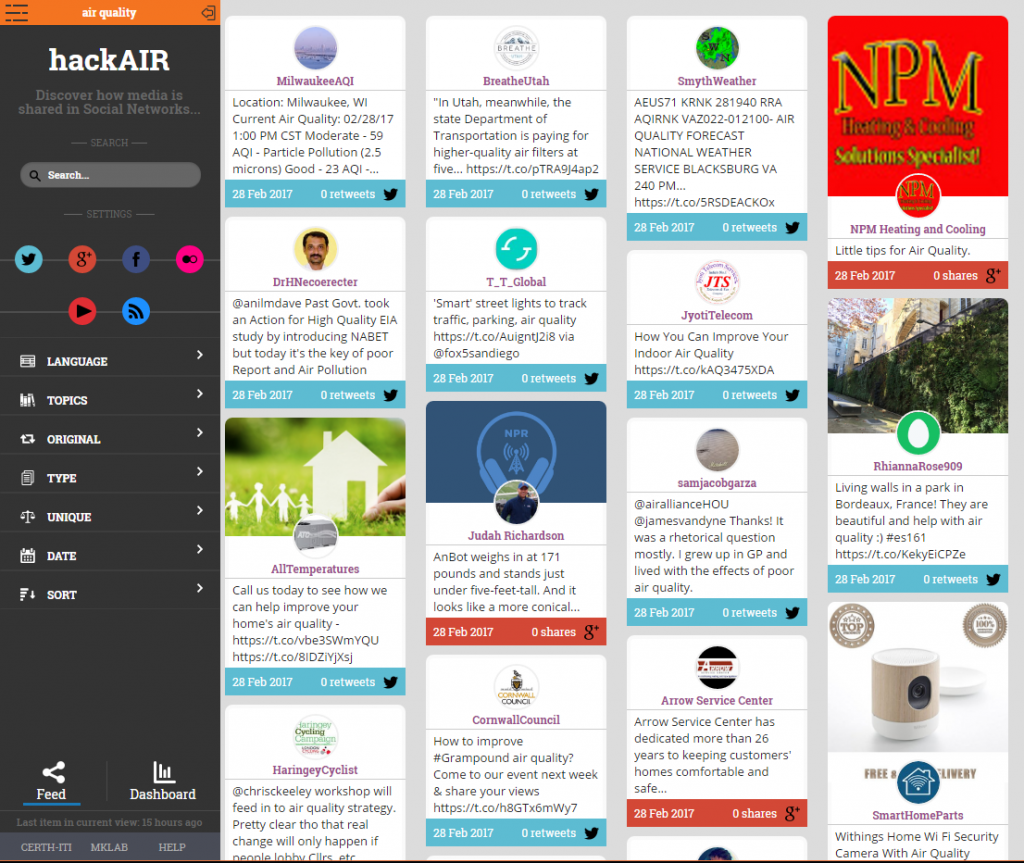
 

Browsing through a feed of social media posts around air quality


The feed view provides a useful means of discovering trending and popular social media content related to air quality topics and entities. However, the real power of the tool is the capability to provide quantitative views and statistics about the monitored content. This is exposed through the “dashboard” view, which is illustrated below. The dashboard consists of several “widgets”, i.e. visualization elements that depict a specific piece of information in an easy-to-grasp way. The first row of widgets concerns the activity and impact measurement of the monitored topic in terms of activity (number of posts), user base (number of users posting), reach (number of users reached) and endorsement (number of users liking the posted content). Another widget depicts the contribution of each social media source (Twitter, Google+, etc.) to the overall activity about the topic. A timeline widget illustrates the activity around the most important keywords over time. There are also two map widgets: a) a heatmap widget showing the levels of activity across the globe based on the location of geotagged posts (i.e. when users chose to share the location of their posts), b) a world map depicting the location of users (by geo-parsing the location field that users have entered in their public user profile page). Finally, there is a histogram widget that shows the most active users around the topic and a keyword bubble widget that depicts the most important keywords around the topic.

The tool source code is available on GitHub: https://github.com/MKLab-ITI/mmdemo-dockerized.
For more information contact: Manos Schinas (manosetro@iti.gr) or Symeon Papadopoulos (papadop@iti.gr)
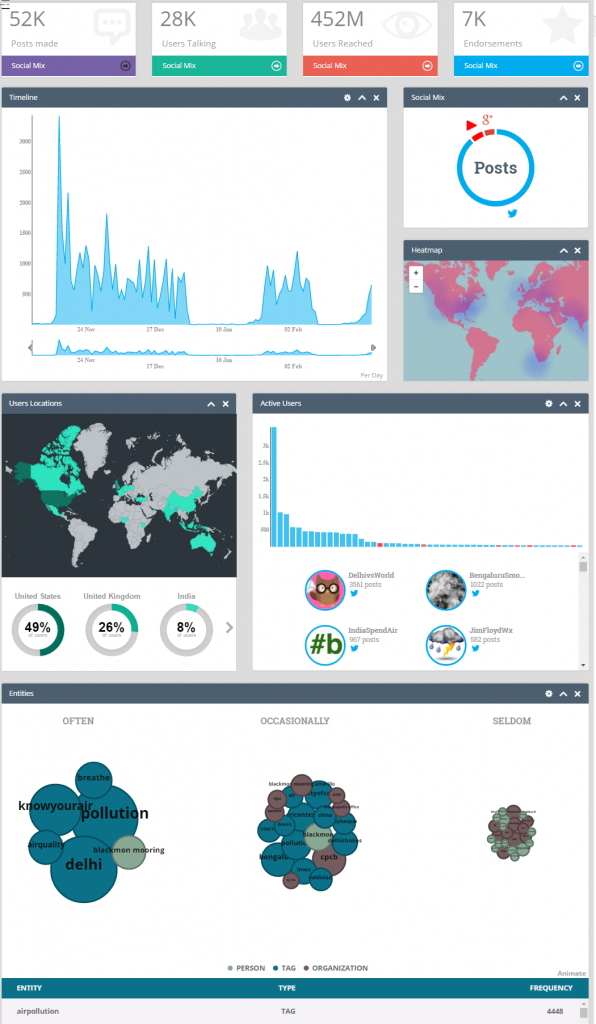
 

Dashboard offering several statistics and visualizations around air quality

Impressions from the Digital Social Innovation Fair 2017

Rome. February 2017. 500 people. 2 days. One big question: How can we embody a human perspective for the next generation internet?

Together with other projects focused on collective awareness platforms for sustainability and social innovation (CAPS), hackAIR participated in the Digital Social Innovation Fair 2017. Our theme: “Collective Sensing and Action”. Sharing a stage with representatives from STARS4ALL, CAPTOR, MAZI and WATIFY projects, Panagiota Syropoulou from DRAXIS presented the latest news from the project and discussed important challenges in engaging users and handling user-generated information.

We also showed an early prototype of the hackAIR Arduino sensor at the event and showed real-time measurements of the air quality of the venue. Visitors showed great interest to build a hackAIR sensor on their own and monitor air pollution. Potential synergies were discussed with representatives of other CAPS projects, such as CAPTOR and EMPATIA.

More about the Digital Social Innovation Fair 2017
Join us at the DSI Manifesto Workshop in Rimini in May 2017.

City of Things

cityofthingsCiti of Things uses the Internet to connect physical objects with each other and with us – to the City of Antwerp. This is what iMinds’ City of Things project is about.

Hundreds of smart sensors and wireless gateways positioned at carefully selected locations across streets and buildings will transform the city into a true living lab for the Internet of Things (IoT).

Find out more at https://www.iminds.be/en/succeed-with-digital-research/go-to-market-testing/city-of-things

What can I do with hackAIR?

What can I do with hackAIR?

Many of you have been asking: “How does hackAIR work – and can I try it out?” Like you we can’t wait for the launch of the platform in summer 2017. Here’s an appetizer of how users will be able to use hackAIR. Meet Karl, Anna and Stephan and read how they use hackAIR to get up-to-date air quality information, upload sensor measurements and raise awareness on air pollution.

The retired teacher Karl (63) has strong concerns with regards to air pollution and is active in a local NGO in Berlin. With little technical knowledge and an Android tablet he mainly uses hackAIR to keep track of the air pollution levels, to warn his daughter Anna when air pollution levels are too high and to upload pictures of the sky via the mobile application. He is also actively stimulating others to engage with the platform and sees hackAIR as a tool to raise awareness and to educate users in air quality. The gamification elements motivate him to take and upload sky pictures multiple times a day and he challenges as as many people as possible to do the same.  

Karl’s busy daughter Anna (32) mainly uses hackAIR to receive personalised notifications on air pollution levels to know if she has to take precautions. When she created her profile on the platform she indicated that she has asthma and is pregnant. Every morning she uses the web app to check the current air quality measurements to decide whether she should bike to work or take the subway. She also contributes to air quality measurement by regularly uploading her sky pictures to Flickr or Twitter with the official hashtag and a location tag. She trusts that privacy and security were key guiding principles when the hackAIR platform was developed.

Her husband Stephan (35) is enthusiastically experimenting with the two sensor toolkits his father-in-law gave him. Data from the environmental sensor attached to his office building and the other one attached to his balcony are automatically uploaded to the platform. Stephan regularly checks hackAIR’s air quality measurements to inform his wife and to decide on which locations and at what hours it is most suitable to go for a run. He has just started to also give his own perceptions of the air quality on specific locations in Berlin. And he convinced some colleagues to use the platform for personalised recommendations on how to reduce air pollution, e.g. by avoiding using the car that day.

Elements of the hackAIR platform

Elements of the hackAIR platform

hackAIR’s open technology platform for citizen observatories on air quality combines multiple data sources to allow citizens to access, collect and improve information about air pollution levels where they live. The hackAIR partnership is currently hard at work developing the platform. Here is a sneak preview at the core models of the system.

Air quality data sources

The hackAIR ecosystem allows citizens to collect air quality information from three sources: digital images, a low-tech filter setup and an open hardware sensor.

Image analysis

Photos of the sky can be used to estimate air pollution for a particular location. For hackAIR, we are taking advantage of public, geo-tagged images posted to online platforms such as Flickr. In addition, users of the hackAIR platform will be able to upload their own pictures of the sky directly to the system.

Low-tech air quality estimation module

Air quality estimates do not necessarily require complicated electronics. Using filters and air pumps, you can build a simple measurement setup to catch particulate matter in a paper filter. Compared with a clean filter, you’ll see the difference with your naked eye. If you snap a picture of the filter with your phone, the hackAIR app provides you with a more accurate air quality score.

Open hardware sensors

Anyone can learn to build a functional air quality sensor, using widely available electronic components like the Arduino microcontroller. As part of its toolkit, hackAIR will provide instructions (and code) to build a sensor compatible with the hackAIR platform. Sensor data can be uploaded to hackAIR.

Discovery and indexing

In addition, hackAIR collects PM2.5 and PM10 measurements from environmental websites and stores this information in a repository that allows time and geo-specific queries. The system is based on a) focused crawling that use machine learning techniques, and b) query formulation and expansion based on domain-specific terms. Then, text mining is applied to the sites discovered and the measurements, time/date and geolocation are extracted.

Air quality data processing

To make sense of the air quality data collected, hackAIR applies image analysis, data fusion and personalisation filters:

Image filtering and analysis

The module processes an image and detects whether it depicts sky or not. If an image doesn’t depict sy, the module discards it from further analysis. Otherwise, it also produces a “mask” that designates the area of the image that corresponds to the sky. This module employs Deep Convolutional Neural Networks (DCNN) to extract an abstract image representation that it then uses to classify an image as “containing sky” or “not containing sky” based on a supervised learning scheme. Then, it applies a similar type of analysis within the sky images to pinpoint the location of the sky in the image.

Air quality mapping using data fusion

Air quality is usually only measured at a few locations. Therefore, a person interested in knowing about the local air quality might not have observations nearby. To solve this issue, we create continuous maps of air quality for an entire region by using an air quality model in combination with the observations. We use geostatistics to combine point-based observations of air quality with spatially exhaustive output from a chemical transport model or a statistical air quality model.

Decision support and personalisation

The module involves an ontological framework and a knowledge base that will store content relations, user profile data, and environmental fused data related to the user query. Reasoning techniques will be applied on these data to provide users with recommendations. This module involves the common representation of heterogeneous information including user profile and needs, and the related environmental data in order to provide personalised and decision support services.

Air quality data access

Users of hackAIR will be able to access the resulting data and air quality maps using

  • a customisable web application; and
  • a mobile app.

APIs will be available for fetching information from the database.

The first version of the hackAIR platform will be available for Germany and Norway in Summer 2017.

Update from the hackAIR team

Update from the hackAIR team

Nine months have passed since the hackAIR kick-off meeting took place… and we have been busy since! Co-creation workshops, the first technical services on image analysis and data retrieval, privacy impact assessment for users and stakeholders and testing air quality estimation with existing sky-depicting images available on social media. Some examples of activities currently undertaken by our consortium partners. 

image03Panagiota Syropoulou (Draxis)

“We are now testing the component of air quality estimation with existing sky-depicting images available on social media, and trying to make the platform as user-friendly as possible!”

Anastasia Moumtzidou (CERTH)

natasa

 “At this moment we are working on three main things. First we’ve just
submitted a report for which we researched how hackAIR will extract data from social media platforms, websites and webcams and host all information. I am developing the first real services by hackAIR; the image analysis module and data retrieval module. And we are updating the social media mining tool. We will soon present some videos to explain this tool!”

image04Arne Fellermann (BUND)

“I’m preparing a series of visits in different local groups throughout Germany to discuss potential applications of our hackAIR tools. One of the latest ideas is to also organise an air quality conference to BUND members in 2017. And in November the first meeting of the air sensing network will take place in Berlin, in which relevant stakeholders will meet to discuss the development and usability of hackAIR in the wider environment.

image02Paulien Coppens (VUB)

“After a first series of co-creation workshops in Berlin and Oslo last June, we are now preparing the second series to explore user requirements in-depth and to gather feedback on the development of the hackAIR platform. We also preparing the privacy impact assessment of end-users and stakeholders to identify and find a solution for the privacy and security risks. Lastly, we research engagement and behavioural change to come up with strategies that promote adoption and usage of hackAIR and stimulate changes in behavioural towards a better air quality.”

image00Hai-Ying Liu (NILU)

“On the 19th of October we organise the second co-creation workshop in Oslo, in which we’ll brainstorm with potential end users about the hackAIR platform to access, collect and upload air quality information. We are constantly working on dissemination at both municipal and national level, aiming at engaging as many participants as possible to contribute to the hackAIR case study in Norway. And NILU is working on developing and implementing a mapping methodology that combines the observations from hackAIR with model information.”

image01Wiebke Herding (ON:SUBJECT)

“This summer we started exploring the use and marketing of hackAIR products and services beyond the project duration. We are building links with other organisations and initiatives in the field, and share knowledge and good ideas about air quality and participatory sensing on Twitter. And of course: we’re happy to present you this newsletter.”

Report: Internet and social media for environmental monitoring

Report: Internet and social media for environmental monitoring

img_20160912_155247

hackAIR partners organised a workshop on “Internet and social media for environmental monitoring” at the 3rd International Conference on Internet Science in Florence, Italy on 12 September 2016. The purpose of the workshop was to present relevant works in the area of environmental monitoring based on data and content from the web and user-generated content posted in social media, as well as to discuss needs from end users and environmental experts in the context of exploiting user generated content and web resources for air quality issues.

Claudio Cavallaro (Politecnico di Milano) presented his work on “Compressing Web geodata for real-time environmental applications”. Claudio presented a two-stage approach for the compression of Digital Elevation Model (DEM) data and geographic entities for a mountain environment monitoring mobile AR application. The proposed method is generic and could be applied to other types of geographical data.

Hai-Ying Liu (Norwegian Institute for Air Research – NILU) gave an overview on her work on “Analysis of public interest in environmental health information: fine-tuning content for dissemination via social media”. The findings of this study highlight the importance of up-to-date informational content, the use of visual con-tent and the role of features for interaction and dialogue to ensure user engagement with a Facebook page on environmental health or citizen science.

Anastasia Moumtzidou (Centre for Research & Technology Hellas – Information Technologies Institute (CERTH-ITI)) presented her work “Towards air quality estimation using collected multimodal environmental data”. Her work is about the development of an open platform, which collects multimodal environmental data related to air quality from several sources including official open sources, social media and citizens.

Panagiota Syropoulou (DRAXIS) introduced her team’s work on the development of a mobile application that offers “Personalised air quality information based on open environmental data and user-generated information”. The proposed application, called ENVI4ALL, offers direct access to personalised and localised information on air quality (current, forecast, and historical), making use of diverse sources of large datasets of open air quality data, and crowdsourced information on the perception of app users about the current air quality.

Interesting points from the open discussion

  • An important challenge for a solution like hackAIR emerges from the fact that most of the public authorities are reluctant to release air quality information for their area. Anyone who wants to provoke policy change towards cleaner air should convince public authorities to publish information on local air quality.
  • An interesting example of using citizens as “sensors” is that of the UK government where citizens can use a specific hashtag at social media to report the level of the snow in their area. The government collects all this information to create a dynamic map of the snow level across UK.
  • Regarding the hackAIR solution, some participants expressed their interest to see also air quality forecasts as this information would be valuable for the protection of their health.

Copyright 2021. All rights reserved

Take part in this short survey and help us improve your hackAIR experience.