hackAIR started in 2016 as a project to develop an open technology toolkit for citizens’ observatories on air quality. It was supported through the EU programme on “Collective Awareness Platforms for Sustainability and Social Innovation” until December 2018.
As we’re coming to the end of the project, we want to celebrate some of the highlights with you: three years hackAIR in action!
Beginnings: 2016
Here is how hackAIR started – some quotes from the project announcement:
“The hackAIR toolkit aims to complement official data with a number of community-driven data sources. […] ‘This crowd-sourced air quality data will provide citizens with improved information about air pollution levels where they live.’ […] The combination of both official open and community-driven data will thus contribute towards both individual and collective awareness about air quality in Europe.”
 We asked: What do citizens need to monitor air quality in their neighbourhood?
Requirements for the hackAIR platform were co-created in workshops with interested stakeholders, in Norway and in Germany. These were the first steps in a well-designed process focusing on user participation and engagement.
Looking back at the first nine months, the hackAIR team reported:
“Nine months have passed since the hackAIR kick-off meeting took place… and we have been busy since! Co-creation workshops, the first technical services on image analysis and data retrieval, privacy impact assessment for users and stakeholders and testing air quality estimation with existing sky-depicting images available on social media.”
Prototypes and development: 2017
 At the Digital Social Innovation Fair in February 2017, latest news from the hackAIR team were presented, including an early prototype of the hackAIR Arduino sensor that showed real-time measurements of the air quality. And, as you see: the panel conversation was captured in visuals!
Behind the scenes of hackAIR during 2016 and 2017, the different parts of the hackAIR platform and app were taking shape. Pilot activities and ways to engage users were prepared.
Ready for action: 2018
 The big moment: the official launch on February 8!
Since its launch, the hackAIR platform has engaged thousands of Europeans. They are monitoring air quality in their neighbourhood in various ways: providing air quality measurements to the platform with their own self-built sensors and taking photos of the sky with the hackAIR app to estimate the air quality.
 Pilot projects in Germany and Norway contributed with a series of workshops to raise awareness of air quality issues and mobilise health-conscious communities. Participating in such a sensor-building workshop created behaviour change regarding air pollution.
A workshop toolkit was designed to support workshop facilitators, providing a number of resources for all who want to organise their own hackAIR workshop.
 The hackAIR tech team prototyped an innovative way to get estimations of the air quality. The hackAIR app includes a feature for taking photos of the blue sky. The analysis process provides an estimation of air quality to the user.
The summer photo contest resulted in 208 submissions from 5 countries (an 367% increase in daily photo submissions during the contest period).
 To make it even easier for citizens to measure air quality, hackAIR offered plug-and-play hackAIR air quality sensors – no soldering, no programming!
The outcome: 100 sensors sold in 3 months! Next batch being prepared for 2019!
 Together with the artist collective Pollution Explorers and Umbrellium, hackAIR was able to try out wearable technologies and new engagement approaches in its workshops.
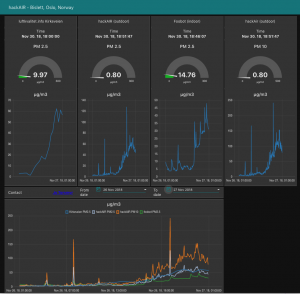
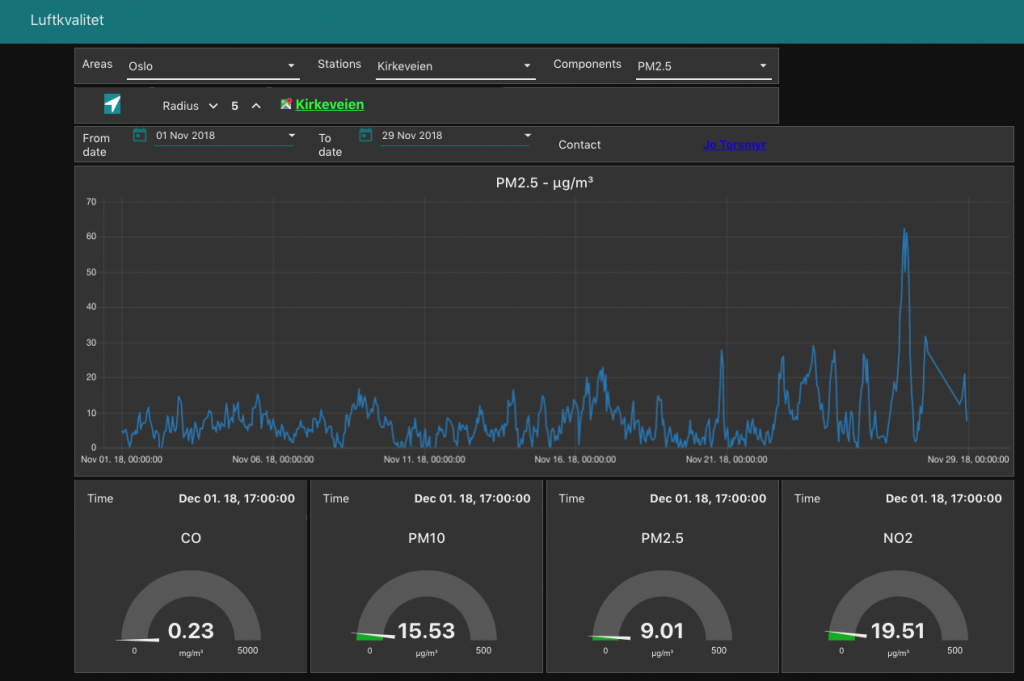
 We published a series of blog posts on data visualisation and sense-making for those who are interested in visualizing their hackAIR sensor data. hackAIR users shared exciting experiments with us: Kniwwelino, Google Data Studio, Google Sheets & other tools.
 A data fusion algorithm calculates estimates for air quality for locations in which no measurements are available. This makes it possible for hackAIR to provide a continuous map of air quality information.
 A Round Table on lower cost air quality sensors was organised by the Joint Research Centre & hackAIR. Governmental authorities, citizen science initiatives, environmental NGOs & academics explored how to collaborate & better leverage each other’s work. Read more here: http://bit.ly/2qxTBQv
This event showed the strong network of stakeholders and related projects that hackAIR has built during its project time.
Onwards! 2019++
The hackAIR platform remains available! Citizens can continue to contribute air quality measurements and access air quality information through the mobile app or web platform. Air quality data can be accessed using an open API – and the full datasets of measurements are available as open data. Source code and hardware designs are available for download under an open licenses and incorporate dozens of community suggestions and improvements.


