By Wolfgang Röckelein
After I had assembled two hackAIR sensors together with my two sons and put them just outside their windows we started wondering in our family: how could we (or our neighbors) profit more from the sensor? What are the daily and weekly variations of the values of your sensor (or your sensor compared to other hackAIR home sensors)?
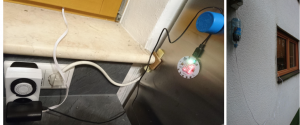
We had been experimenting with some Kniwwelinos, and started using them as an addition to the hackAIR home sensor. A “Kniwwelino” is a small and cheap computer device for use in education. They come from Luxemburg, and have some nice features making them an ideal companion to the hackAIR home sensor: They have Wifi connectivity, a 5×5 LED matrix, a RGB LED and two buttons, are USB-powered and are cheap (around 12€). Plus they use the same CPU and development environment as the hackAIR home sensors!
I developed a script for the Kniwwelino to regularly obtain the most current readings of one hackAIR home sensor from the hackAIR platform (no need to change anything on your hackAIR home sensor and your neighbors could use the same approach to see the measurements). The index value (very good, good, medium and bad) sets the RGB LED color to green, yellow, orange and red respectively and when you press a button you see either the PM2.5 or the PM10 reading from your sensor as scrolling text on the LED matrix. The script is public source, so feel free to get one (or two or three…) Kniwwelinos to get an up-to-date display on your hackAIR home sensor readings. You need an USB power supply and should use a mechanical clock timer so the Kniwwelino is only operating when you are awake and at home in order to conserve energy. You can programme the sensor ID the Kniwwelino should use and the ID is stored in flash memory, so it is used when the clock timer repowers the device.

For more data visualizations built on top of the hackAIR air quality data, see our overview post.


